Volume Confirmation: WEAK (volume declining, but still present on key moves)
Ema Relationship: Price below 20, 50, and 200 EMAs across timeframes, bearish alignment
Fvg Context: No significant FVGs visible in the immediate vicinity
Atr Context: Current volatility supportive of potential breakout from this pattern
Multi Timeframe Assessment
Timeframe Alignment
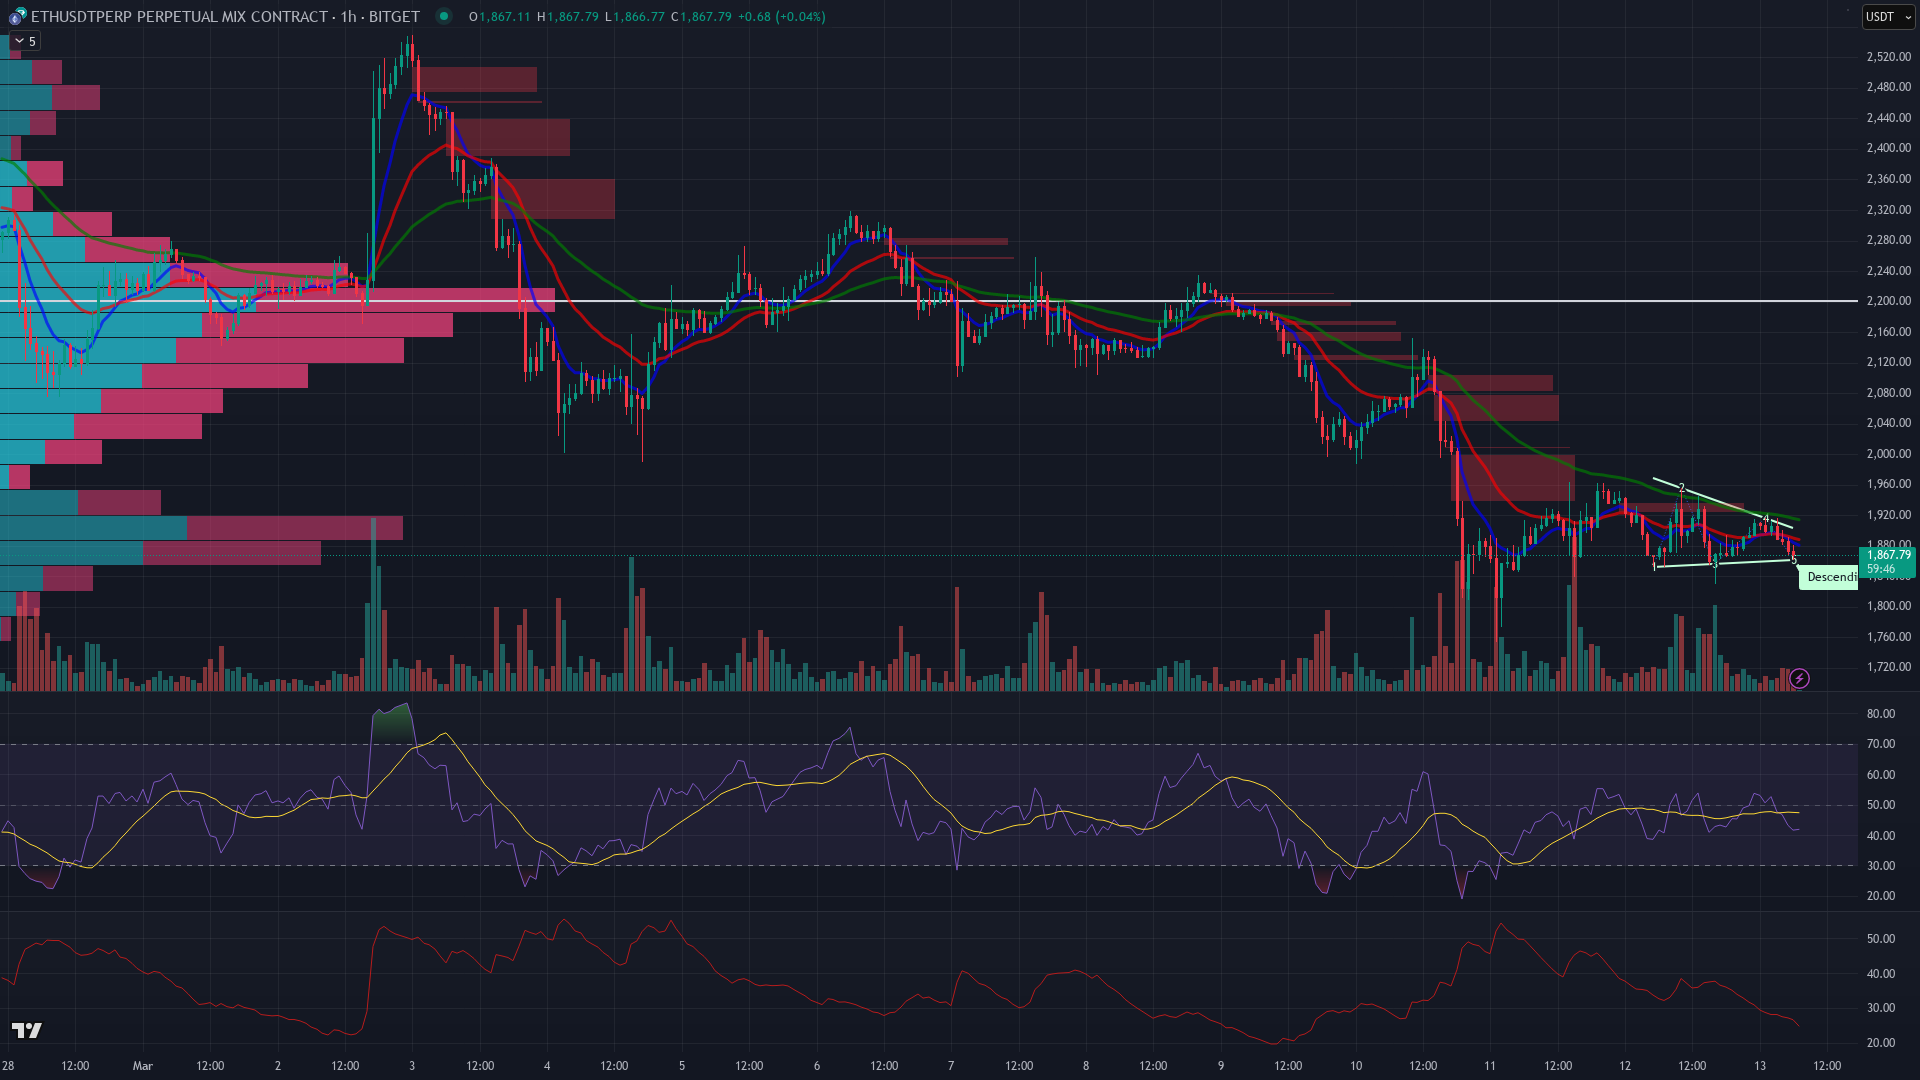
H1 Bias: BEARISH
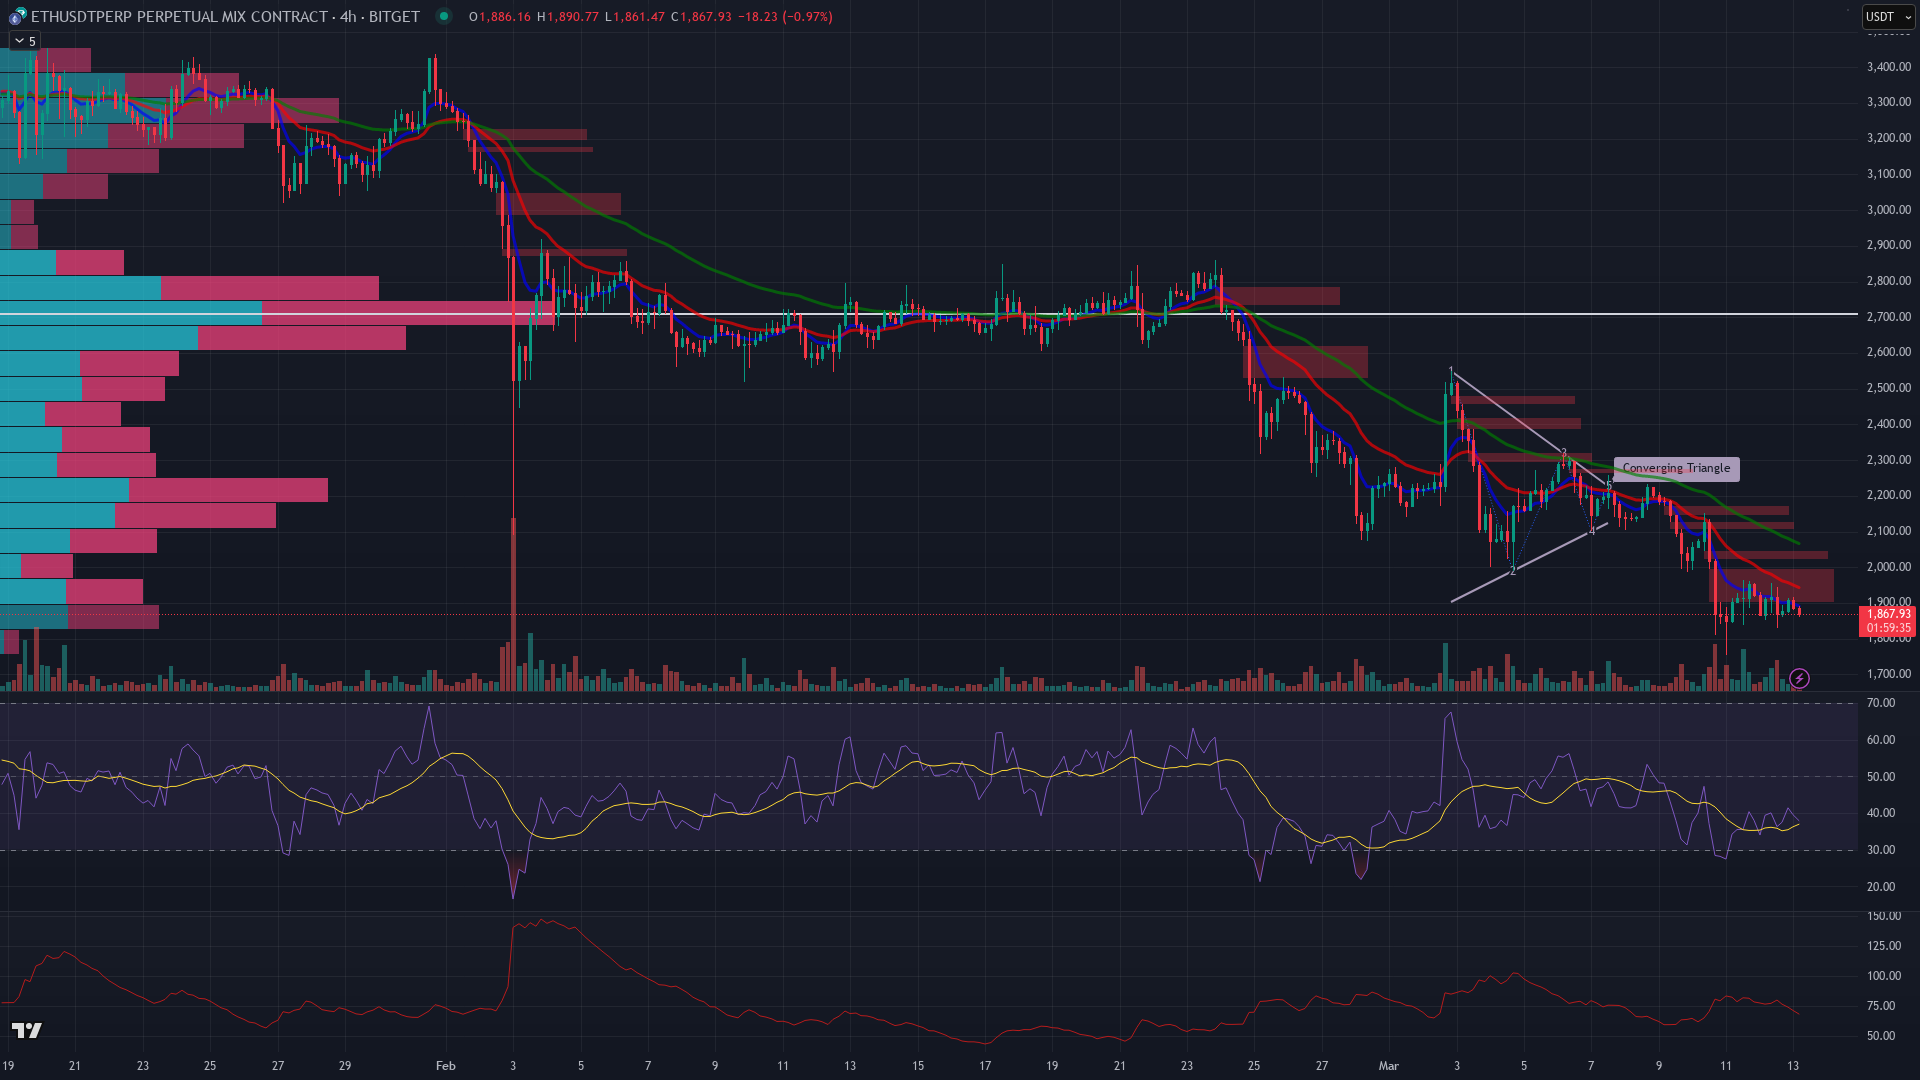
H4 Bias: BEARISH
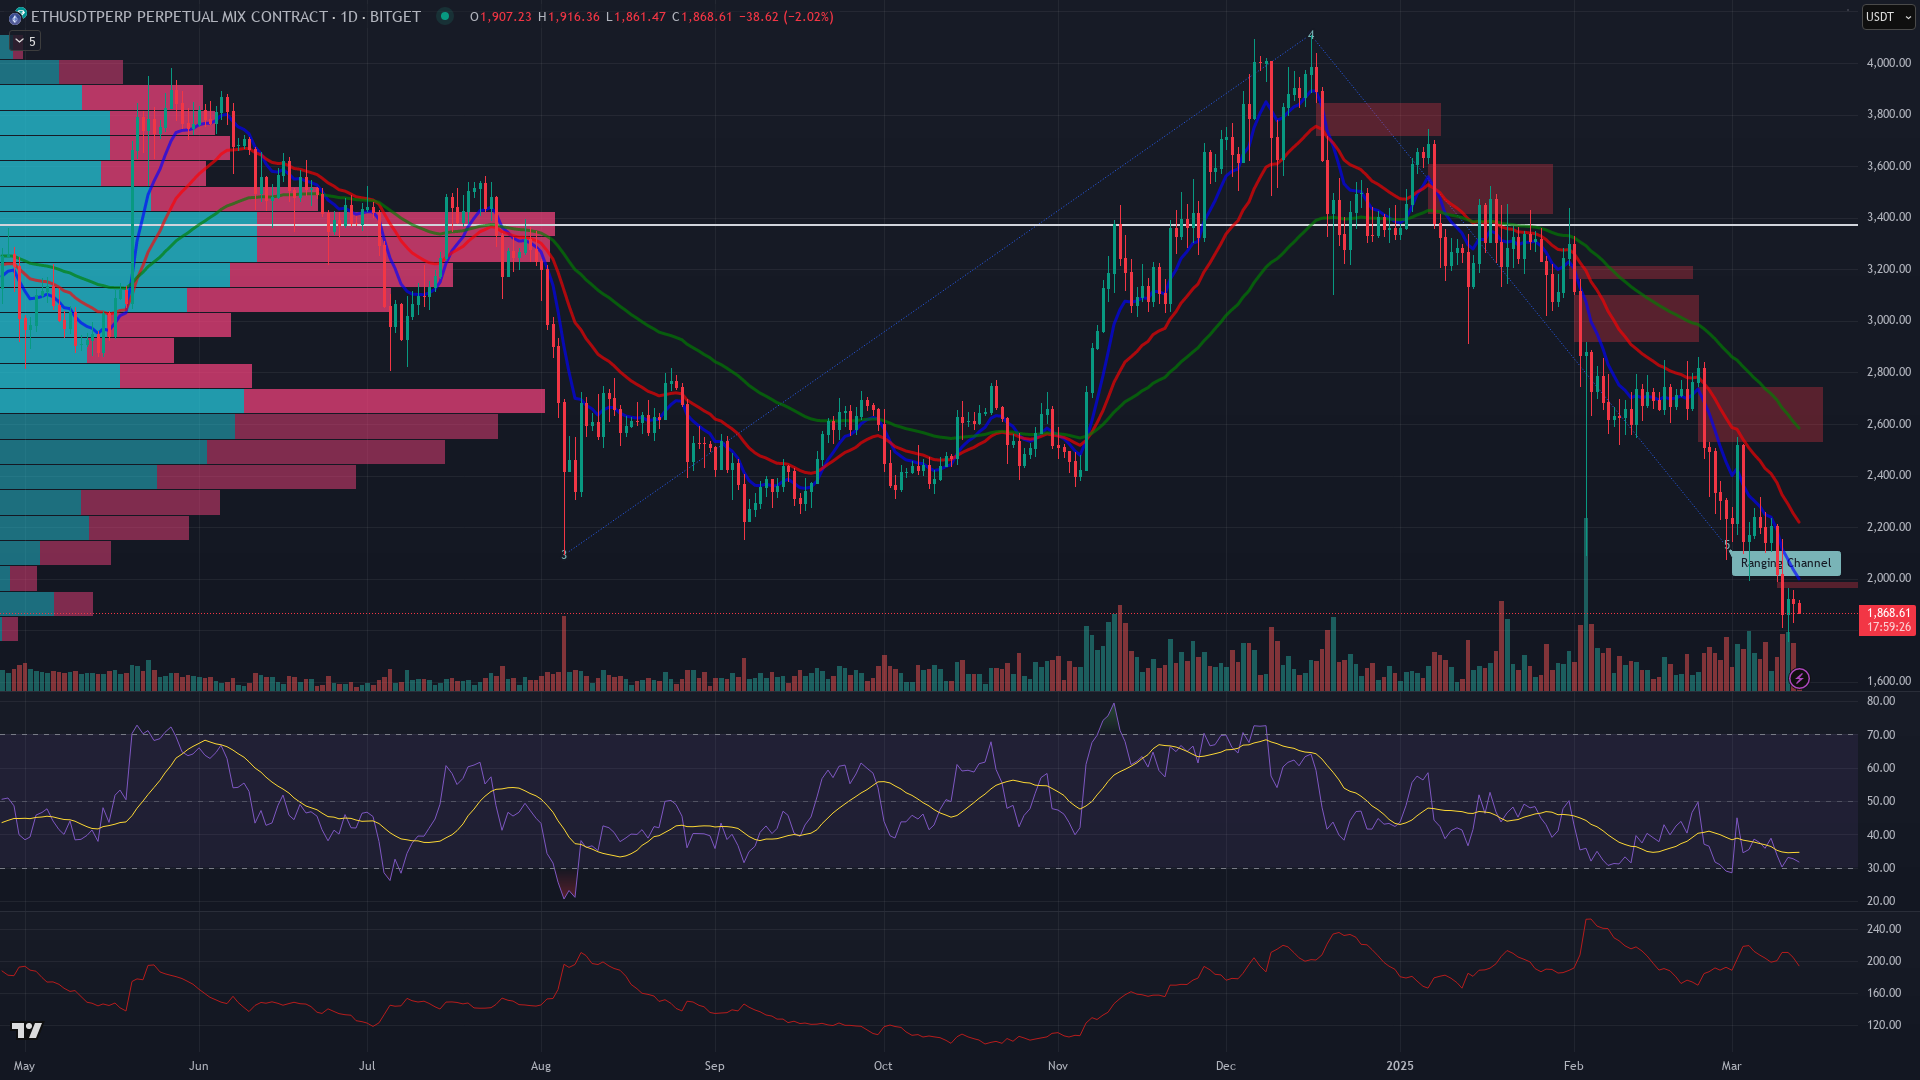
Daily Bias: BEARISH
Alignment Score: STRONG
Key Levels
Support Zones: NA
Resistance Zones: NA
Liquidity Pools: NA
Probability Assessment
Completion Probability: MODERATE (70% chance of bearish resolution given macro alignment and technical structure)
False Breakout Risk: MODERATE (25% chance of upside fakeout due to potential broader market stabilization)
Stop Hunt Vulnerability: HIGH (significant liquidity likely placed above recent highs, vulnerable to stop hunts)
Time Decay Risk: Pattern should resolve within 24-48 hours, consider invalid if exceeding 72 hours without clear direction
Trade Decision
Confidence Score: 6.8
Confidence Category: CONDITIONAL
Decision: CONDITIONAL
Direction: SHORT
Reasoning: Pattern aligns with macro risk-off sentiment and technical bearish bias across timeframes. However, proximity to key support and potential for market stabilization warrant caution.
Trade Execution Plan
Entry
Zone: 1860 - 1880
Trigger: Bearish candle close below 1860 on 1H timeframe with increased volume
Order Type: LIMIT
Timing Window: Next 24 hours, preferably during US market hours
Risk Management
Stop Loss Price: 1925
Stop Loss Logic: Just above recent high and upper trendline of descending triangle
Position Sizing: 1% of trading capital, considering 65 point stop
Max Holding Time: 72 hours from entry
Take Profit
Tp1 Price: 1800
Tp1 Justification: Previous support level and psychological round number
Tp2 Price: 1750
Tp2 Justification: Extension of pattern height from breakout point
Scaling Strategy: Close 50% at TP1, move stop to breakeven, ride remainder to TP2
Invalidation Scenarios
Clean break and hold above 1920 with strong volume
BTC breaks above and holds $85,000, indicating potential trend reversal
Monitoring Focus
Confirmations Needed: NA
Warning Signals: NA
Correlated Assets: NA
You might also like...
24
Apr
04/24 - Custom Trade analysis of FARTCOINUSDT (15m)
2 min read
16
Apr
04/16 - Custom Trade analysis of FARTCOINUSDT (15m)
2 min read
15
Apr
04/15 - Custom Trade analysis of BTCUSDT (1h)
2 min read
15
Apr
04/15 - Custom Trade analysis of FARTCOINUSDT (1h)