Risk Mode Alignment: NEUTRAL with provided risk mode
Volatility Suitability: SUITABLE for current moderate volatility
Liquidity Sufficiency: SUFFICIENT for trade execution
Money Flow Compatibility: NEUTRAL to pattern direction
Macro Confidence Impact: The consolidating market with slight bearish bias aligns with the ascending triangle pattern, but caution is warranted due to the transitional phase
Technical Environment
Btc Influence: NEUTRAL to this setup
Sector Trend: NEUTRAL
Volume Profile: CONCERNING
Correlations: Potential impact from S&P 500 short-term recovery and weakening USD
Pattern Critical Analysis
Classification
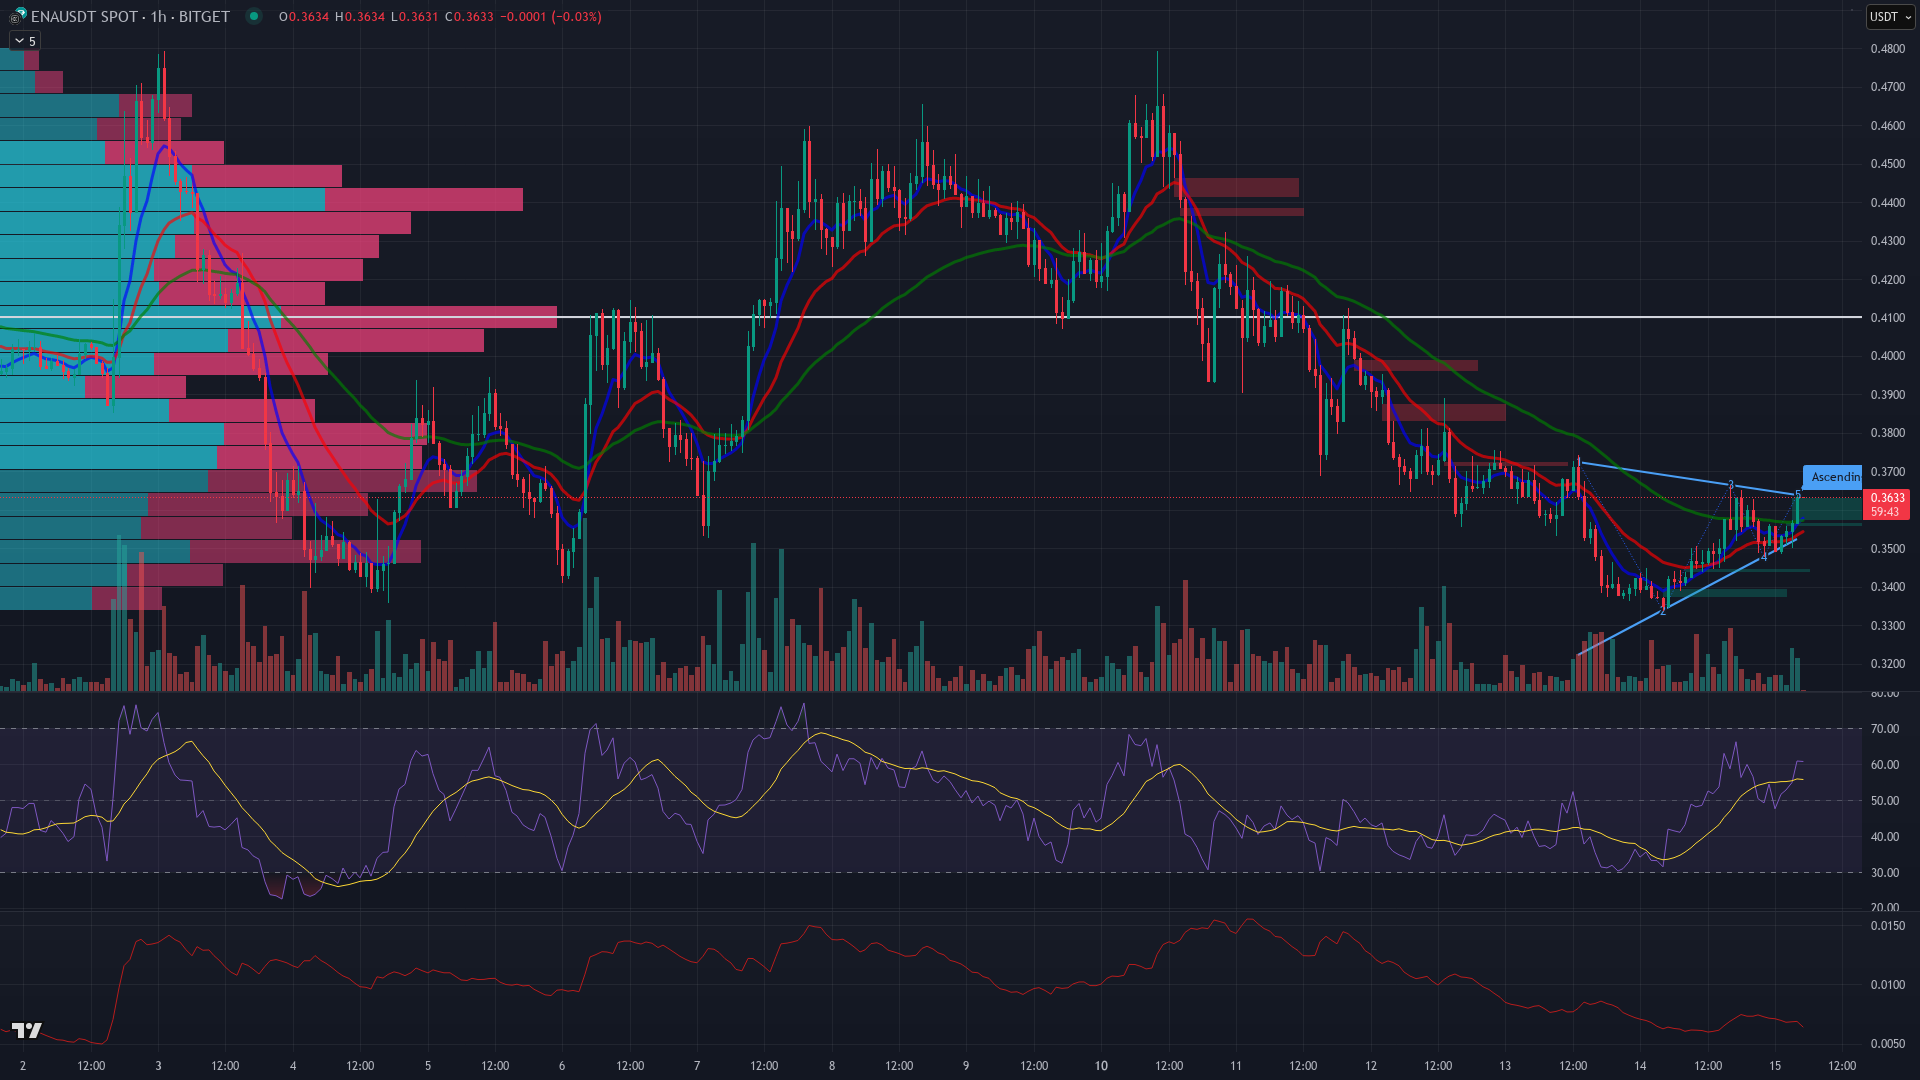
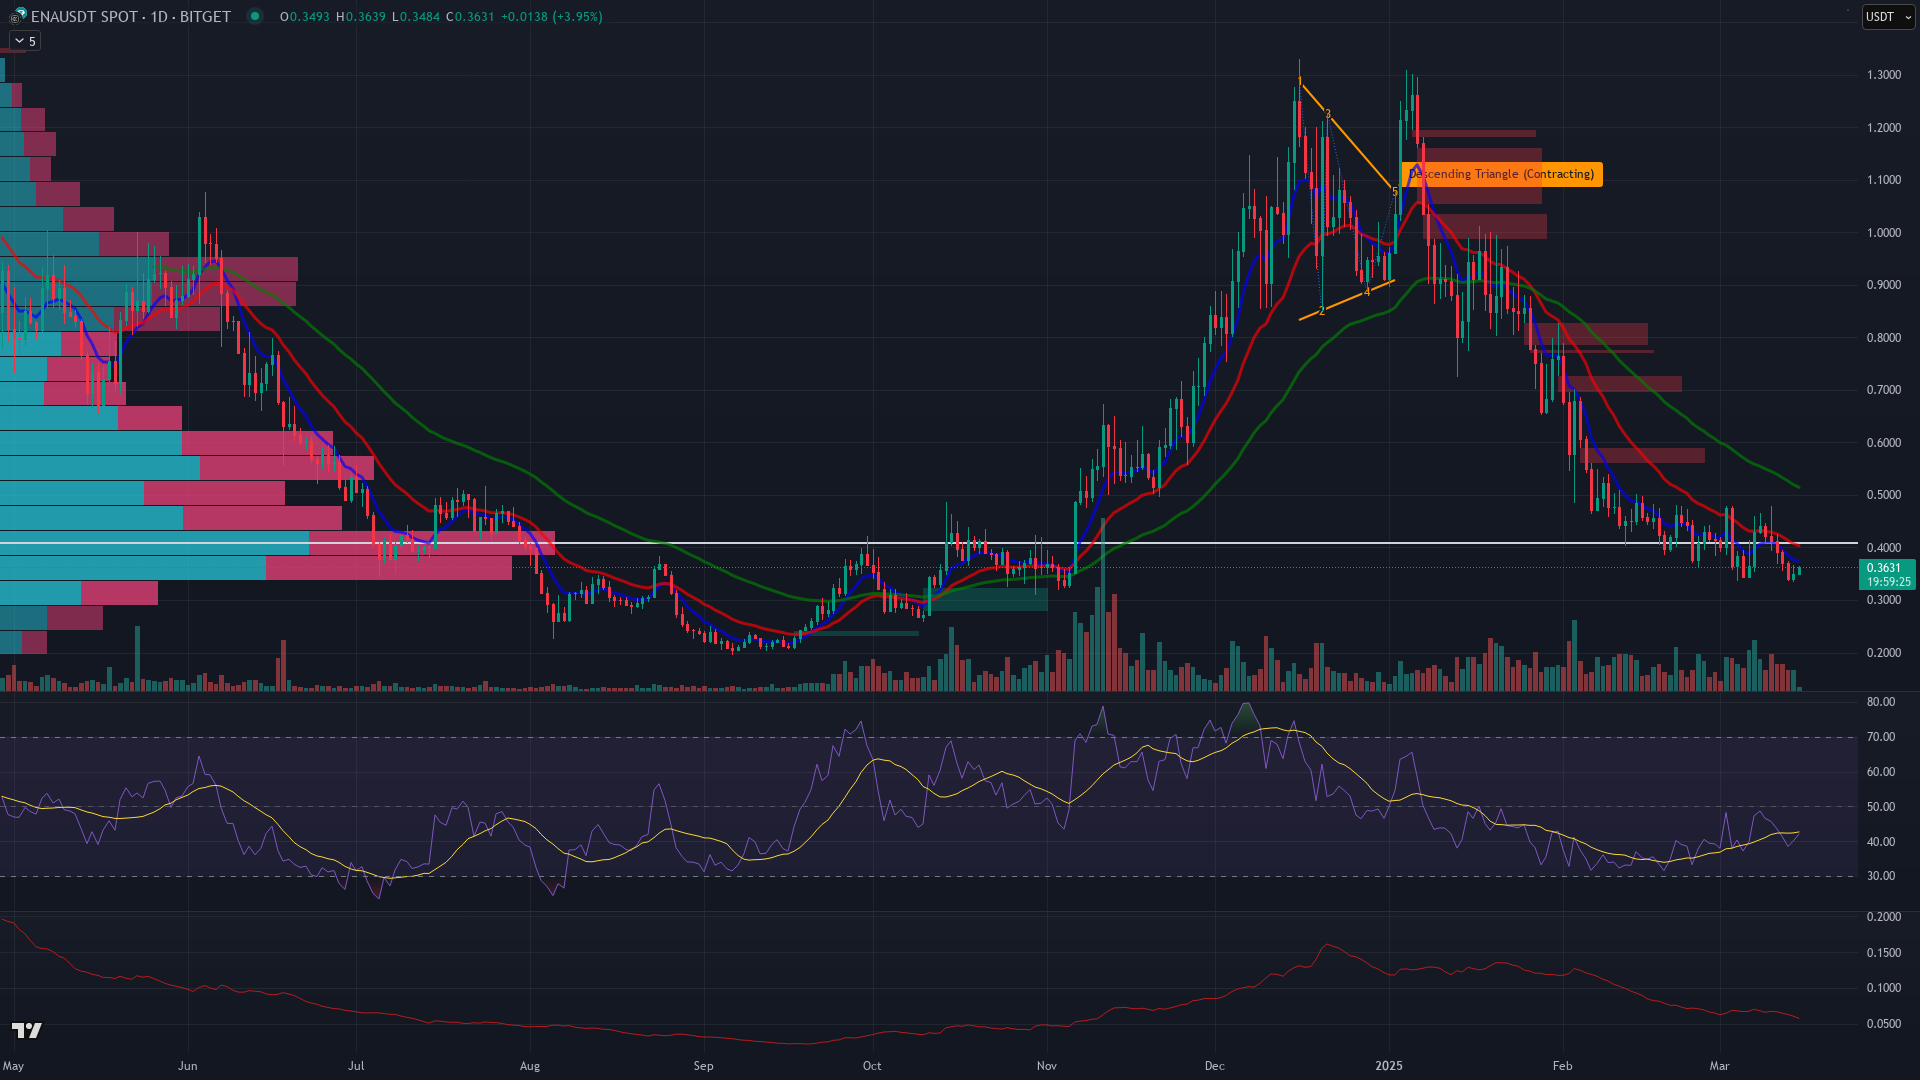
Pattern Type: Ascending Triangle (Contracting)
Formation Quality: MODERATE
Completion Status: PARTIAL
Historical Reliability: Moderately reliable in consolidating markets, but success rate diminishes in bearish environments
Technical Validation
Rsi Confirmation: NEUTRAL
Volume Confirmation: WEAK
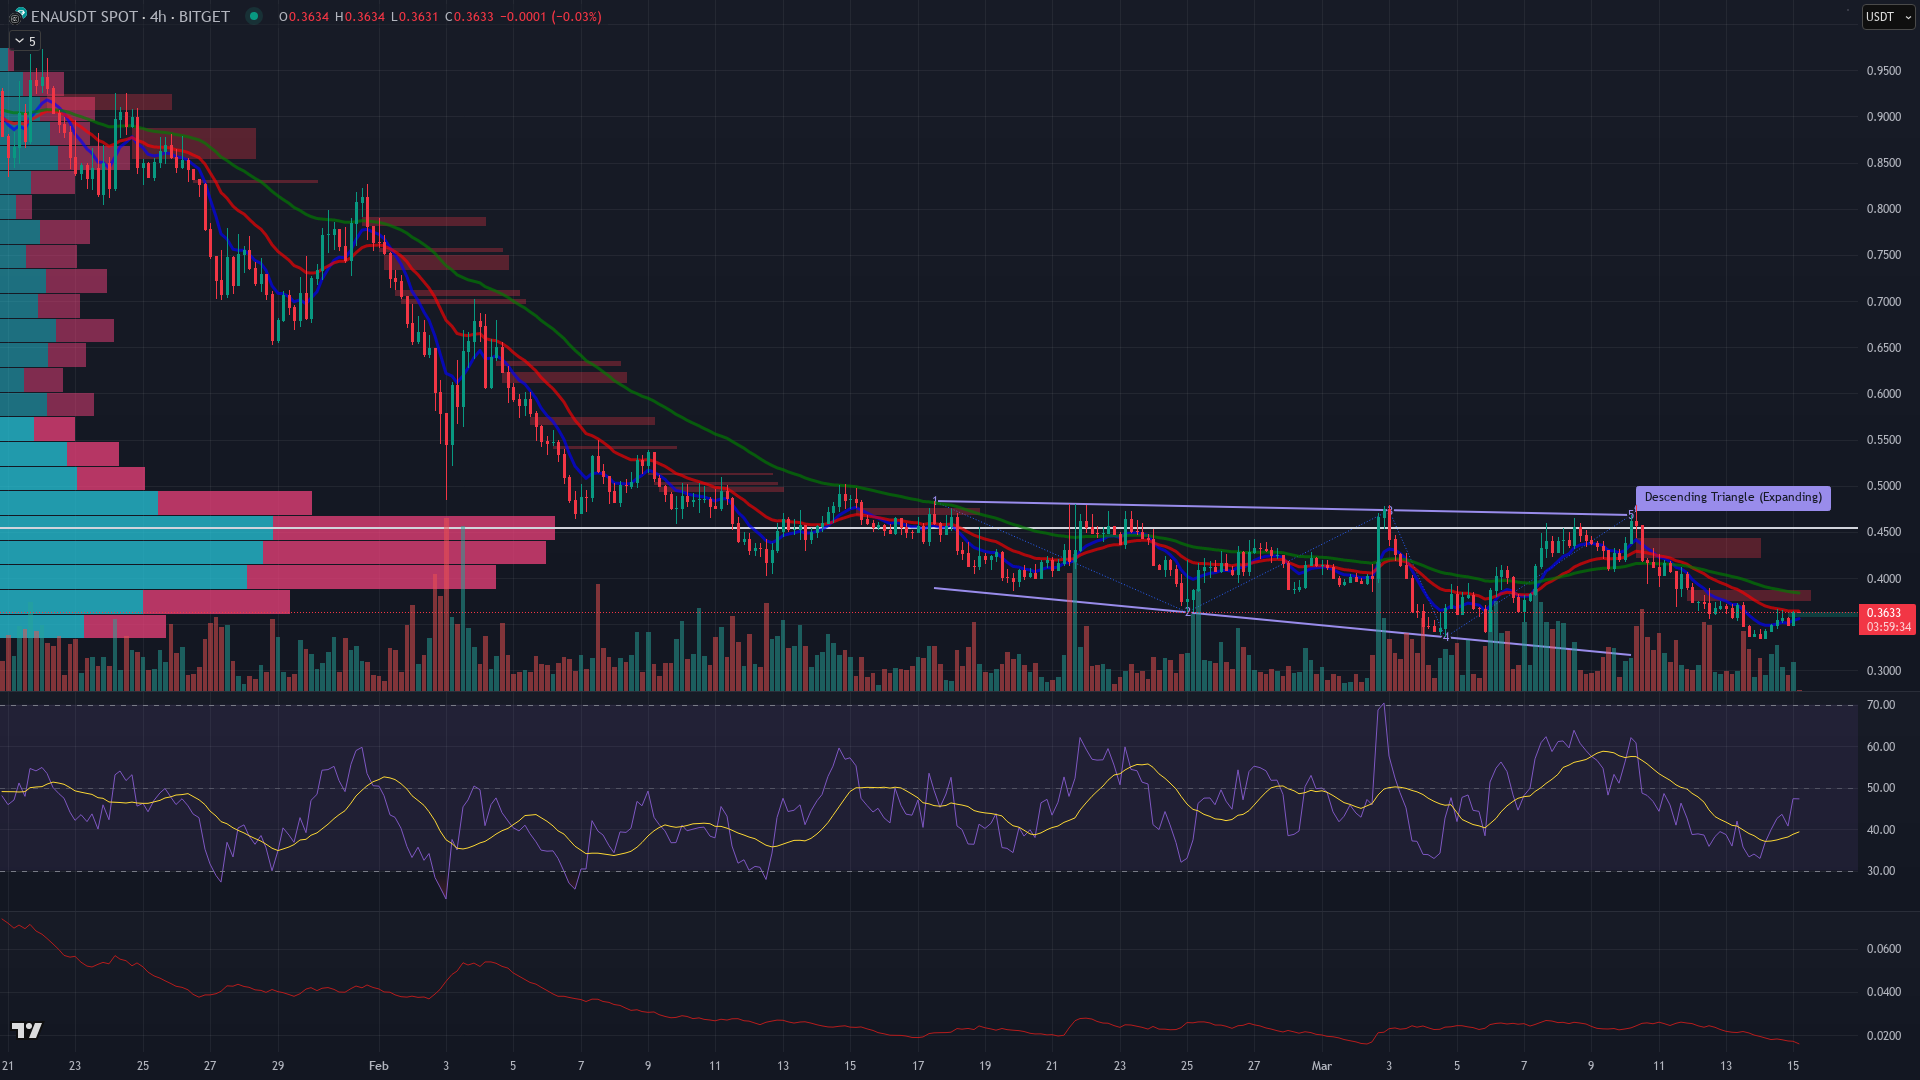
Ema Relationship: Price below 20 and 50 EMA on 1H and 4H, bearish alignment
Fvg Context: No significant Fair Value Gaps visible in the immediate vicinity
Atr Context: Current volatility supports potential breakout, but volume is lacking
Multi Timeframe Assessment
Timeframe Alignment
H1 Bias: NEUTRAL
H4 Bias: BEARISH
Daily Bias: BEARISH
Alignment Score: WEAK
Key Levels
Support Zones: NA
Resistance Zones: NA
Liquidity Pools: NA
Probability Assessment
Completion Probability: LOW due to bearish higher timeframes and lack of volume
False Breakout Risk: HIGH due to weak volume and bearish higher timeframe trend
Stop Hunt Vulnerability: MODERATE, potential for stops below 0.3400 to be targeted
Time Decay Risk: Pattern should resolve within 48-72 hours, otherwise consider failed
Trade Decision
Confidence Score: 5.2
Confidence Category: LOW (0-5.9)
Decision: NO
Direction: NONE
Reasoning: While the 1H chart shows an ascending triangle, higher timeframes are bearish, volume is weak, and the pattern contradicts the overall market structure. The risk of a false breakout is high.
You might also like...
24
Apr
04/24 - Custom Trade analysis of FARTCOINUSDT (15m)
2 min read
16
Apr
04/16 - Custom Trade analysis of FARTCOINUSDT (15m)
2 min read
15
Apr
04/15 - Custom Trade analysis of BTCUSDT (1h)
2 min read
15
Apr
04/15 - Custom Trade analysis of FARTCOINUSDT (1h)