Risk Mode Alignment: ALIGNED with provided risk mode
Volatility Suitability: SUITABLE for current volatility
Liquidity Sufficiency: SUFFICIENT for trade execution
Money Flow Compatibility: SUPPORTIVE to pattern direction
Macro Confidence Impact: Macro analysis supports a cautiously bullish outlook, aligning with the ascending triangle pattern
Technical Environment
Btc Influence: SUPPORTIVE to this setup
Sector Trend: STRENGTHENING
Volume Profile: MIXED
Correlations: Positive correlation with BTC and overall crypto market strength
Pattern Critical Analysis
Classification
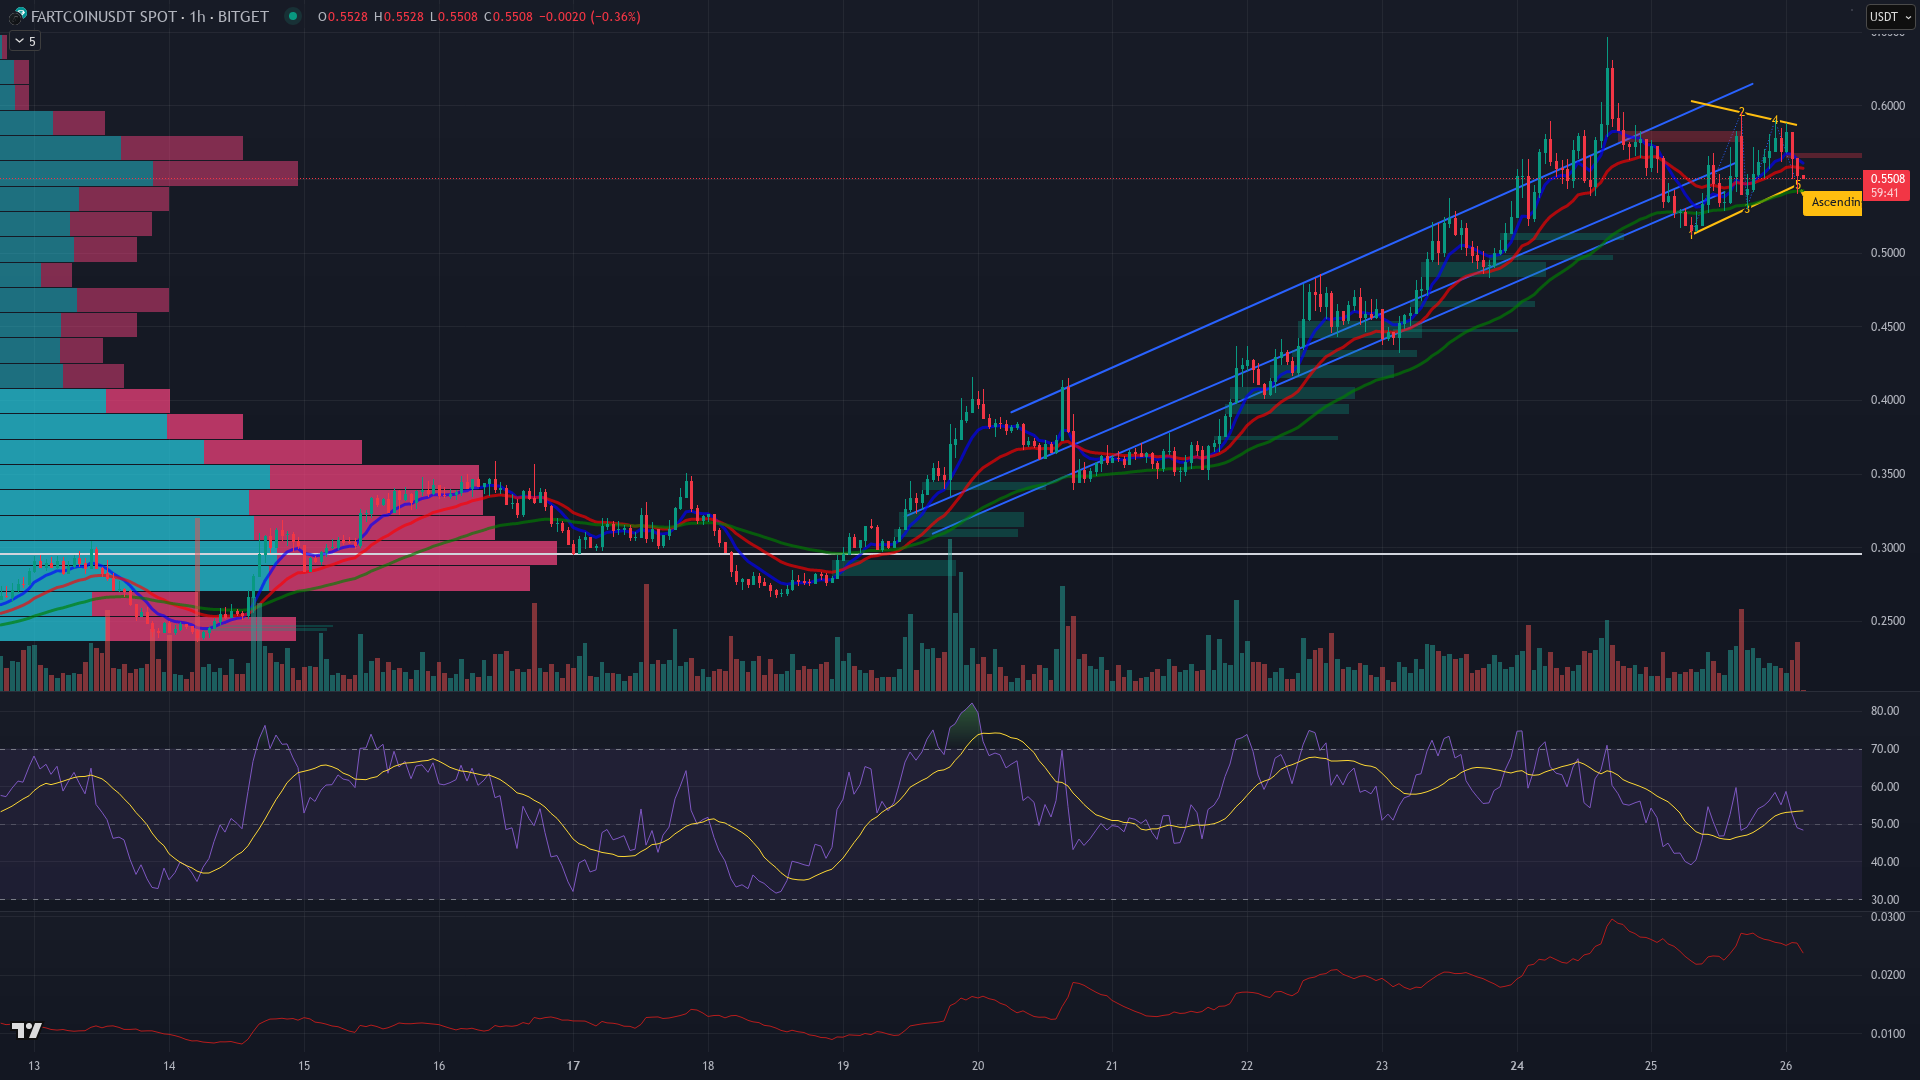
Pattern Type: Ascending Triangle (Contracting)
Formation Quality: MODERATE
Completion Status: PARTIAL
Historical Reliability: Moderately reliable in bullish market conditions, but requires confirmation
Technical Validation
Rsi Confirmation: NEUTRAL
Volume Confirmation: WEAK
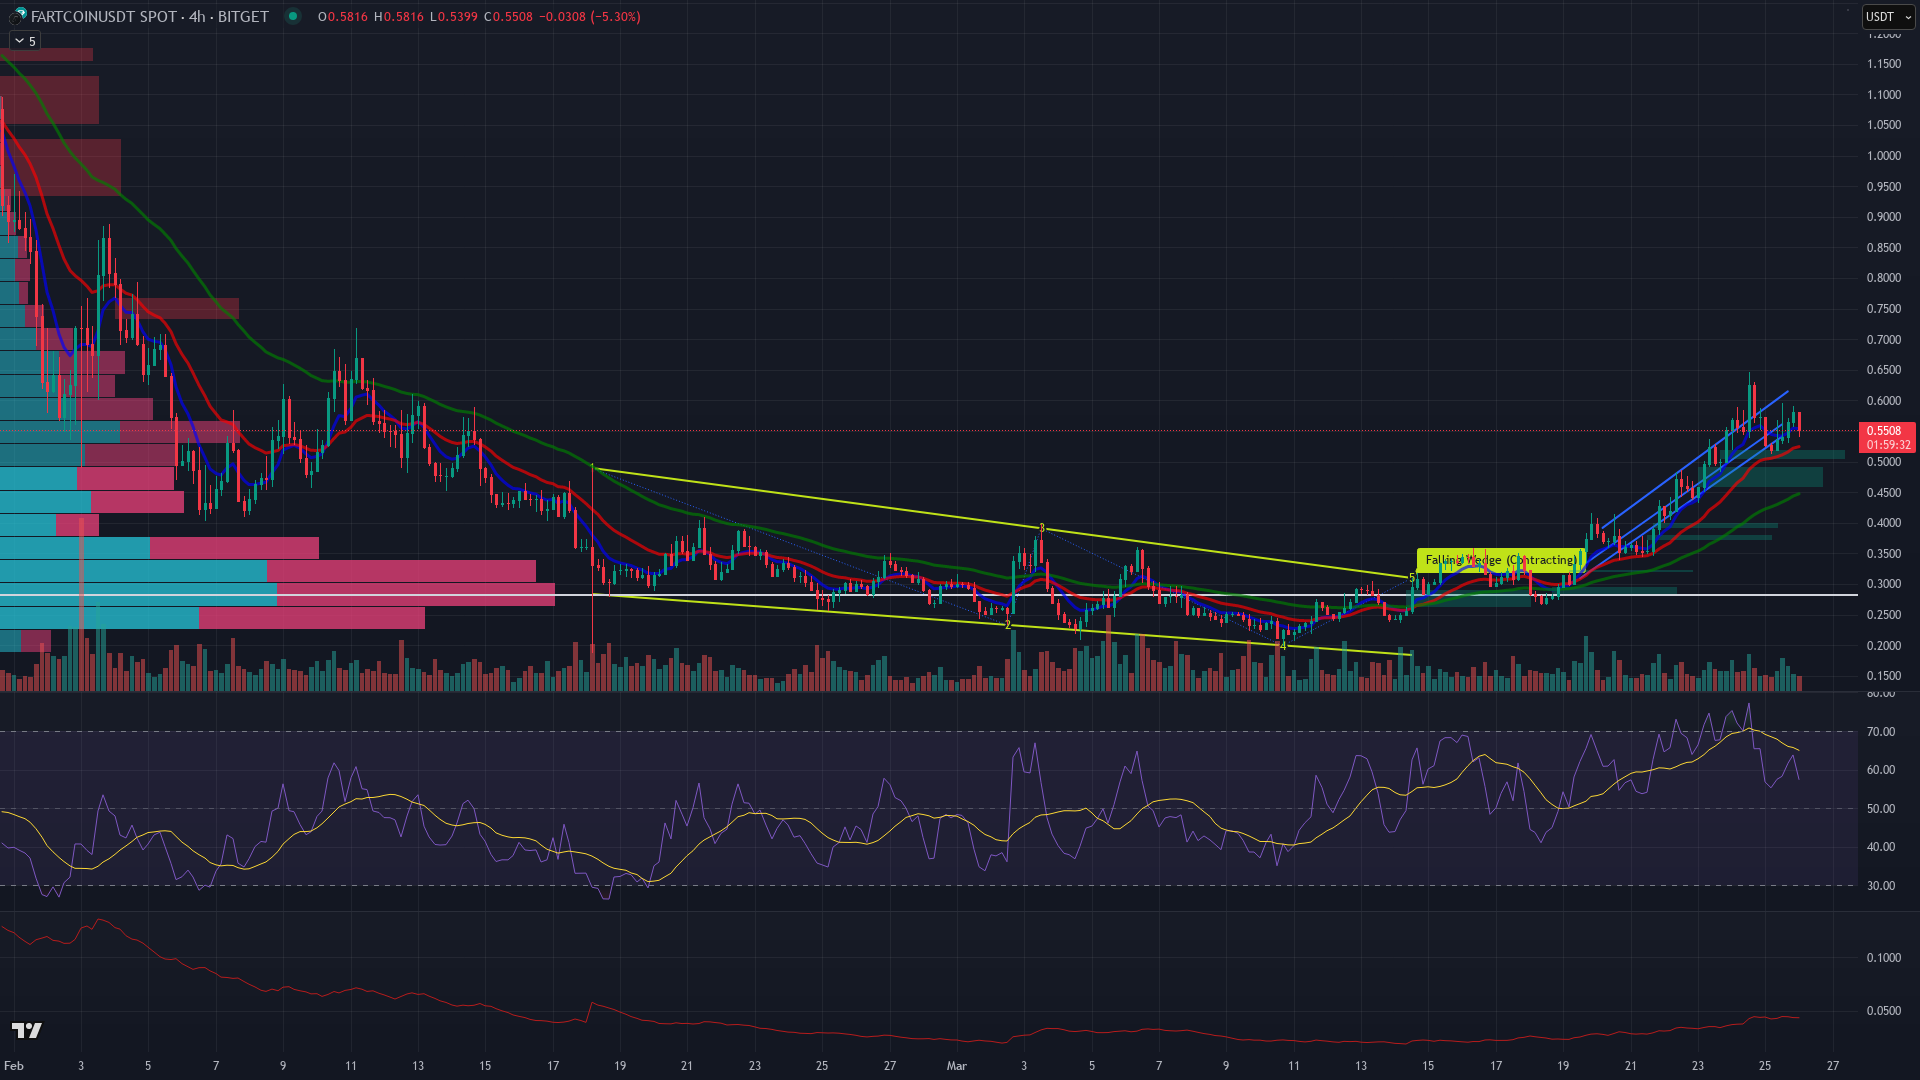
Ema Relationship: Price above 20 and 50 EMA on 1H and 4H, bullish alignment
Fvg Context: No significant FVGs visible in the immediate vicinity
Atr Context: Current volatility supportive of gradual upward movement
Multi Timeframe Assessment
Timeframe Alignment
H1 Bias: BULLISH
H4 Bias: BULLISH
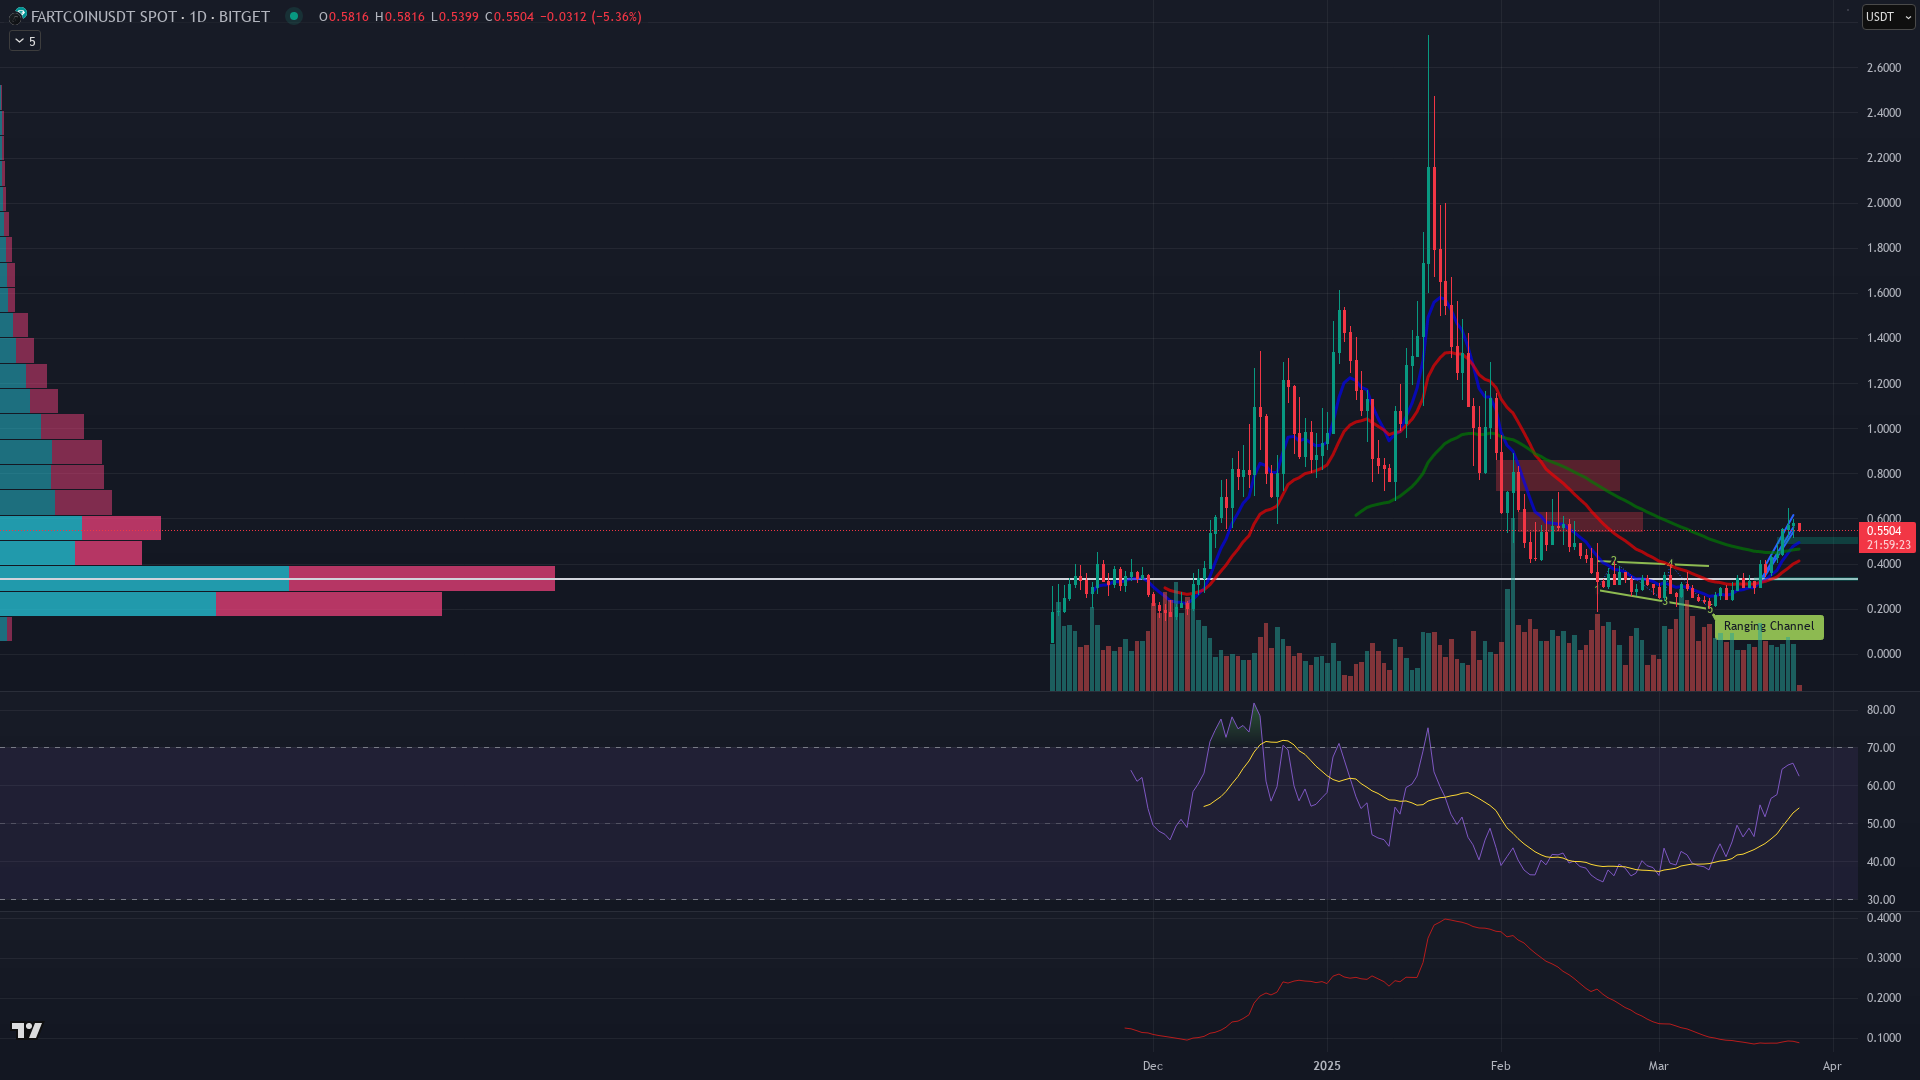
Daily Bias: NEUTRAL
Alignment Score: MODERATE
Key Levels
Support Zones: NA
Resistance Zones: NA
Liquidity Pools: NA
Probability Assessment
Completion Probability: MODERATE - pattern is forming but lacks strong volume confirmation
False Breakout Risk: MODERATE - weak volume could lead to a false breakout
Stop Hunt Vulnerability: LOW - clear support levels provide protection
Time Decay Risk: 48-72 hours before considering the pattern failed
Trade Decision
Confidence Score: 6.2
Confidence Category: CONDITIONAL
Decision: CONDITIONAL
Direction: LONG
Reasoning: Pattern aligns with macro outlook but lacks strong volume confirmation. Multi-timeframe analysis is supportive, but daily timeframe is neutral. Requires additional confirmation before entry.
Trade Execution Plan
Entry
Zone: 0.5600 - 0.5650
Trigger: Break above 0.5650 with increased volume
Order Type: LIMIT
Timing Window: Next 24-48 hours
Risk Management
Stop Loss Price: 0.5450
Stop Loss Logic: Below recent swing low and ascending trendline
Position Sizing: 1% of trading capital
Max Holding Time: 5 days
Take Profit
Tp1 Price: 0.5900
Tp1 Justification: Previous resistance level
Tp2 Price: 0.6100
Tp2 Justification: Psychological level and liquidity pool
Scaling Strategy: Exit 50% at TP1, move stop loss to breakeven
Invalidation Scenarios
Break below 0.5450 support level
Failure to break above 0.5650 within 48 hours
Monitoring Focus
Confirmations Needed: NA
Warning Signals: NA
Correlated Assets: NA
You might also like...
24
Apr
04/24 - Custom Trade analysis of FARTCOINUSDT (15m)
2 min read
16
Apr
04/16 - Custom Trade analysis of FARTCOINUSDT (15m)
2 min read
15
Apr
04/15 - Custom Trade analysis of BTCUSDT (1h)
2 min read
15
Apr
04/15 - Custom Trade analysis of FARTCOINUSDT (1h)